Turning a fanless mini-PC into an inline firewall and network observability platform.
Introduction
One of the most interesting characteristics of OpenBSD is how much can be accomplished with a relatively small system, a carefully designed network configuration, and a few native Unix tools.
My latest project started with a simple objective: introduce an additional security and monitoring layer into my home network without replacing the existing router, changing the internal addressing scheme, or disrupting the services already running.
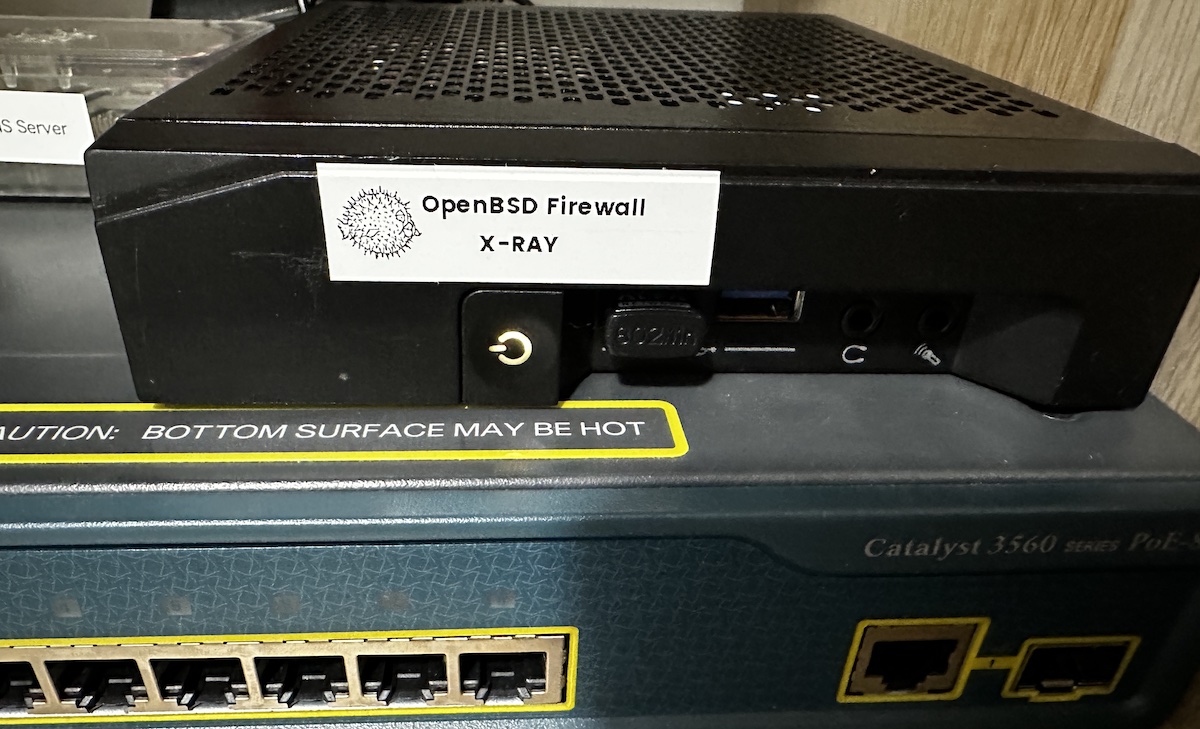
The result is a transparent Ethernet bridge based on OpenBSD 8.0, running on a fanless Fujitsu mini-PC with an Intel Celeron J4105 processor.
The system operates between my Internet router and the FRITZ!Box that serves the internal network. It combines OpenBSD’s native bridging capabilities, the PF packet filter, and a custom monitoring application written in Go, called X-RAY.
The important design principle is straightforward: the bridge should remain as transparent as possible to the network, while making traffic and security events observable.
Hardware Platform
The hardware is modest, but more than adequate for the task.
| Component | Specification |
|---|---|
| System | Fujitsu D3544-Sx |
| Processor | Intel Celeron J4105, 4 cores |
| Base / Burst Frequency | 1.5 / 2.5 GHz |
| Memory | 4 GB DDR4 |
| Storage | Kingston SSD |
| Internal Ethernet | Intel I210 (em0) |
| External Ethernet | Realtek RTL8168 (re0) |
| Management | Realtek RTL8188EU USB Wi-Fi (urtwn0) |
| Operating System | OpenBSD 8.0 amd64 |
| Cooling | Fanless |
During normal operation, the system reports CPU temperatures around 35°C, with a load average typically close to zero.
OpenBSD also exposes individual CPU frequency sensors. Although the J4105 has a nominal frequency of 1.5 GHz, its cores can dynamically operate above 2 GHz using Intel Burst.
For a machine performing packet filtering, traffic collection, and web dashboard processing, there is considerable unused processing capacity.
Network Architecture
The bridge sits between two existing network devices.
                    INTERNET
                       |
                       |
                   Fiber Router
                    10.xx.xx.xx  - (/29)
                       |
                       | 1 Gbps
                       |
                  re0 (Realtek)
                +----------------+
                |                |
                |  OpenBSD 8.0   |
                |                |
                |    bridge0     |
                |      + PF      |
                |      + X-RAY   |
                |                |
                +----------------+
                  em0 (Intel)
                       |
                       | 1 Gbps
                       |
                 Internal Router 4040
                    10.xx.xx.xx - (/29)
                       |
                  Internal LAN
                 172.xx.xx.xx - (/25)
The physical interfaces re0 and em0 belong to bridge0.
Unlike a conventional routed firewall, the bridge does not introduce a new Layer 3 hop between the two devices. Ethernet frames are forwarded at Layer 2, while PF can inspect and filter the IP traffic traversing the system.
This provides several practical advantages:
- No need to redesign the existing IP addressing.
- No additional NAT layer.
- No routing changes on the TP-Link or FRITZ!Box.
- Security filtering independent of the existing router.
- Visibility into traffic crossing the bridge.
The system has a separate management interface:
urtwn0 — 172.xx.xx.xx/25
This Wi-Fi interface provides SSH access and hosts the X-RAY web dashboard on port 9091.
Keeping management separate from the bridged Ethernet interfaces is useful operationally, although it introduces its own dependency: if the Wi-Fi adapter becomes unavailable, the management plane may be unreachable even while the bridge continues forwarding traffic.
Packet Filtering with PF
OpenBSD’s Packet Filter is responsible for security enforcement.
The configuration uses a persistent table named malicious, populated with IP networks from the Spamhaus DROP dataset.
A simplified excerpt of the active filtering rules illustrates the approach:
table <malicious> persist file "/etc/pf.malicious"

block drop out log quick on re0 inet from <malicious> to any
block drop log quick on em0 inet from any to <malicious>
One detail worth emphasizing is that filtering direction on a transparent bridge must be understood in relation to the actual packet path and interface attachment.
In this deployment, the relevant inbound Internet filtering rule is applied on re0 with the out direction. This was verified against observed traffic and PF logs rather than assumed from the physical cabling alone.
The blocklist is maintained in /etc/pf.malicious, allowing the same data to be loaded when the PF ruleset is initialized.
A scheduled update mechanism downloads and validates the Spamhaus data before refreshing the existing PF table.
Importantly, updating a PF table does not require reloading the entire firewall configuration:
pfctl -t malicious -T replace -f /etc/pf.malicious
This allows threat intelligence data to change while the rest of the network configuration remains stable.
X-RAY: Building an Observability Layer
PF is extremely capable, but its traditional interface is primarily command-line based.
Commands such as pfctl, tcpdump, netstat, and systat provide detailed information, although correlating their output manually is not always convenient.
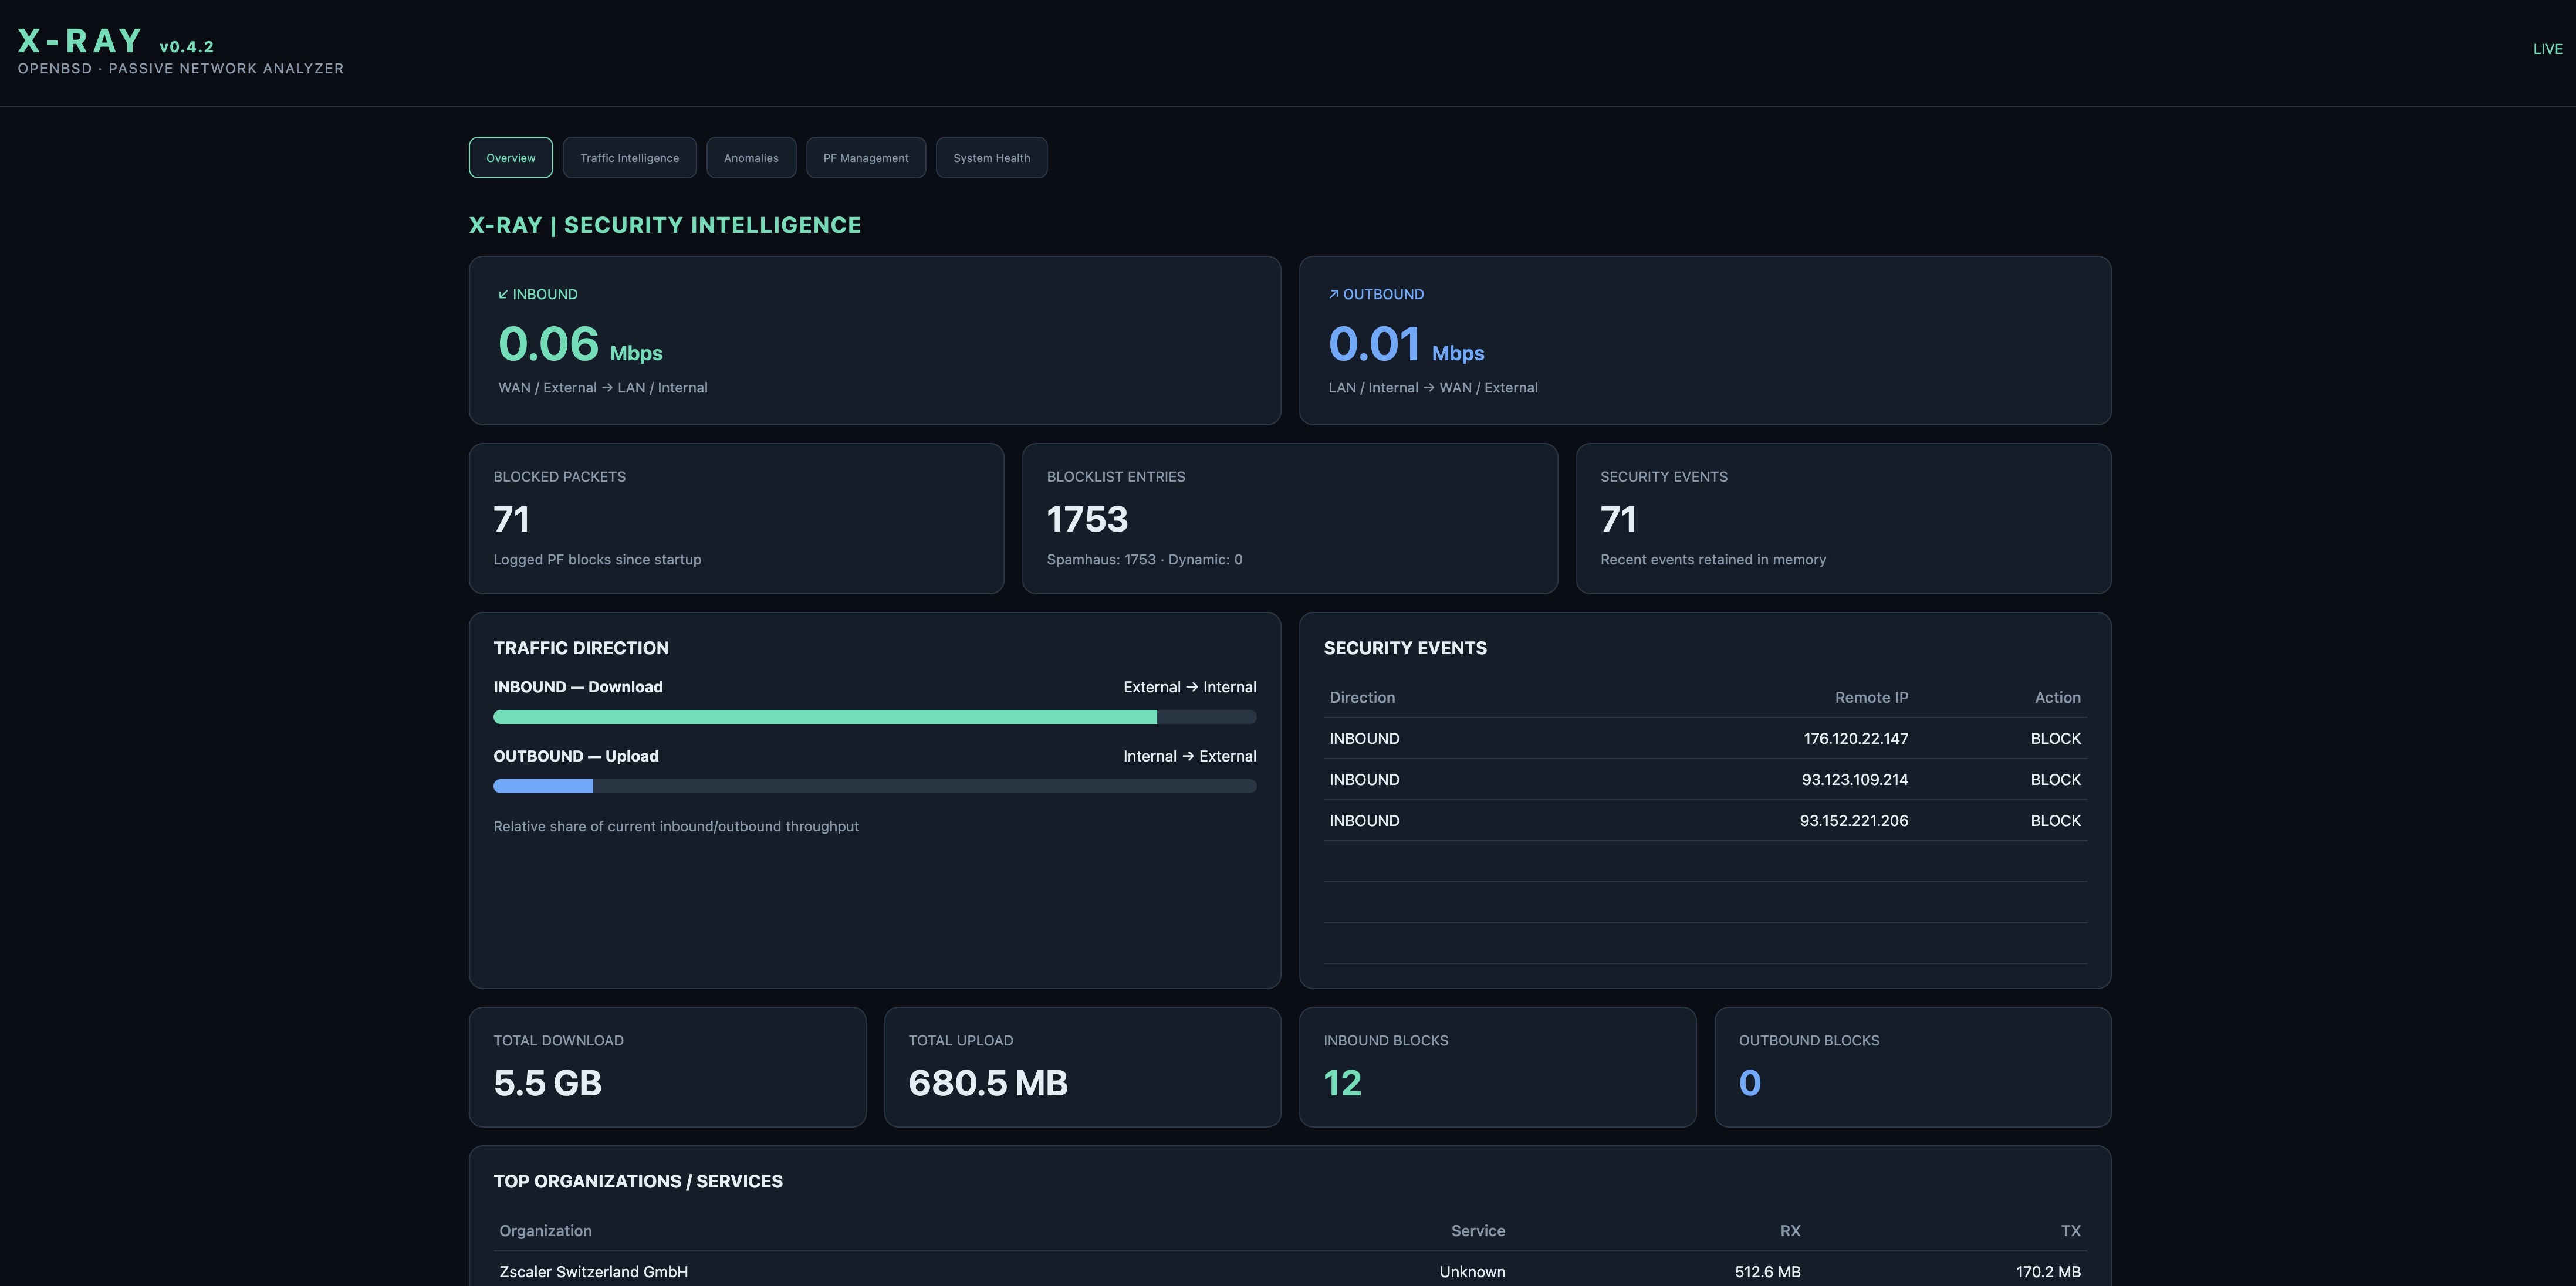
This led to the development of X-RAY, a lightweight network observability application written in Go.
X-RAY is not intended to replace PF. It is designed to expose and correlate information already available from the operating system.
The application separates privileged collection from the web-facing component, which runs with reduced privileges and communicates with the backend through a Unix domain socket.
Its dashboard is organized around five functional areas:
Overview
A summary of the system’s operational state, traffic activity, and important security indicators.
Traffic Intelligence
Traffic is enriched with autonomous system information using a local GeoLite2 ASN database.
Instead of showing only destination IP addresses, X-RAY can identify organizations and networks associated with the observed traffic.
For example, traffic to Internet DNS infrastructure may be attributed to organizations such as RIPE NCC or ARIN.
ASN attribution is useful, but it is not the same as geographic location or threat reputation. Those are separate data dimensions and should not be confused.
Anomalies
A dedicated view for identifying unusual network behavior and activity that deserves closer inspection.
PF Management
A read-only view of PF statistics, state-table information, filtering activity, and logged security events.
One particularly useful feature is the grouping of related PF events, reducing the need to inspect repetitive raw log lines.
For example, X-RAY observed the following inbound event:
| Attribute | Value |
|---|---|
| Remote address | 77.90.185.78 |
| Destination | 10.xx.xx.xx:443 |
| Protocol | TCP SYN |
| Direction | Inbound |
| Observed packets | 1 |
This represents an observed connection attempt, not evidence of a successful intrusion.
External reputation services may provide additional context about the source address, but that information should remain distinct from what PF actually observed.
System Health
The system-health dashboard collects operating-system metrics, including:
- CPU temperature and ACPI thermal-zone temperature.
- Individual CPU core frequencies.
- System load.
- Network interface error counters.
- Historical changes in interface errors.
For a transparent bridge, interface health is particularly important. A rising error count on either bridged Ethernet interface can affect network service, while errors on the Wi-Fi adapter may affect only the management plane.
That distinction is essential for useful monitoring.
Operational Lessons
Several practical observations emerged during deployment.
A transparent bridge is still critical infrastructure.
Although the machine is relatively simple, it sits directly in the network path. Stability, predictable boot behavior, and conservative configuration changes are more important than adding features.
Management availability and forwarding availability are different things.
A problem with the USB Wi-Fi adapter can make SSH and the dashboard unreachable without necessarily indicating that Ethernet forwarding has stopped.
For that reason, external monitoring is valuable. A separate NetWatch instance can check the management address and HTTP dashboard independently of X-RAY’s internal health reporting.
PF logs need context.
A single TCP SYN directed at port 443 is not, by itself, proof of an attack. Direction, action, source, destination, protocol, repetition, and timing all matter.
Threat intelligence should remain separate from enforcement logic.
A reputation score or ASN attribution can assist investigation, but it should not automatically be interpreted as evidence of malicious activity.
Small Unix systems remain remarkably capable.
A four-core Celeron with 4 GB of memory can comfortably support a transparent bridge, packet filtering, traffic collection, and a Go-based observability service without requiring a large software stack.
Next Steps
The project is evolving incrementally.
The immediate focus is validating the X-RAY 0.4.2 improvements to network health, PF event grouping, and traffic classification.
A later release will extend Traffic Intelligence with protocol, destination port, and service identification, allowing traffic to be grouped by remote IP, protocol, and destination port.
Additional work is planned around external monitoring, historical reporting, and correlation with other locally operated monitoring services.
The intention is not to turn a simple bridge into an unnecessarily complex security appliance. It is to make the existing network infrastructure more observable while preserving its reliability.
Conclusion
This project demonstrates a design philosophy I have appreciated throughout my years working with Unix systems: use a small number of well-understood components, keep responsibilities clearly separated, and build additional functionality only where it provides measurable value.
OpenBSD provides the networking foundation. PF provides enforcement. X-RAY provides visibility.
The result is a compact, transparent security bridge that fits into an existing network without demanding that the network be redesigned around it.
Hardware: Fujitsu D3544-Sx · OS: OpenBSD 8.0 · Firewall: PF · Monitoring: X-RAY (Go)
Leave a comment